
Every tool needed to read the market clearly
Tradex GPT brings pricing data, screening tools, and portfolio views into one dashboard — built for investors who want structured information, not noise.
A dashboard organized around how investors actually work
Each module in Tradex GPT addresses a distinct step of market research — from first scan to ongoing review — without forcing you into a single workflow.
Unified market view
Track instruments across German and international exchanges side by side, without switching between separate tools or tabs.
Custom screening filters
Narrow down large lists of securities using criteria you set — sector, size, historical range, and other data-backed parameters.
Structured watchlists
Group instruments into watchlists that reflect your own research priorities, and revisit them with consistent, comparable layouts.
Historical data panels
Review price and volume history over adjustable time frames to understand context before forming a view.
Portfolio overview
See holdings summarized in one place, with figures that update as underlying market data changes.
Alert configuration
Set notifications tied to price levels or data thresholds you define, so you can step away without losing track.
Designed to reduce clutter, not add to it
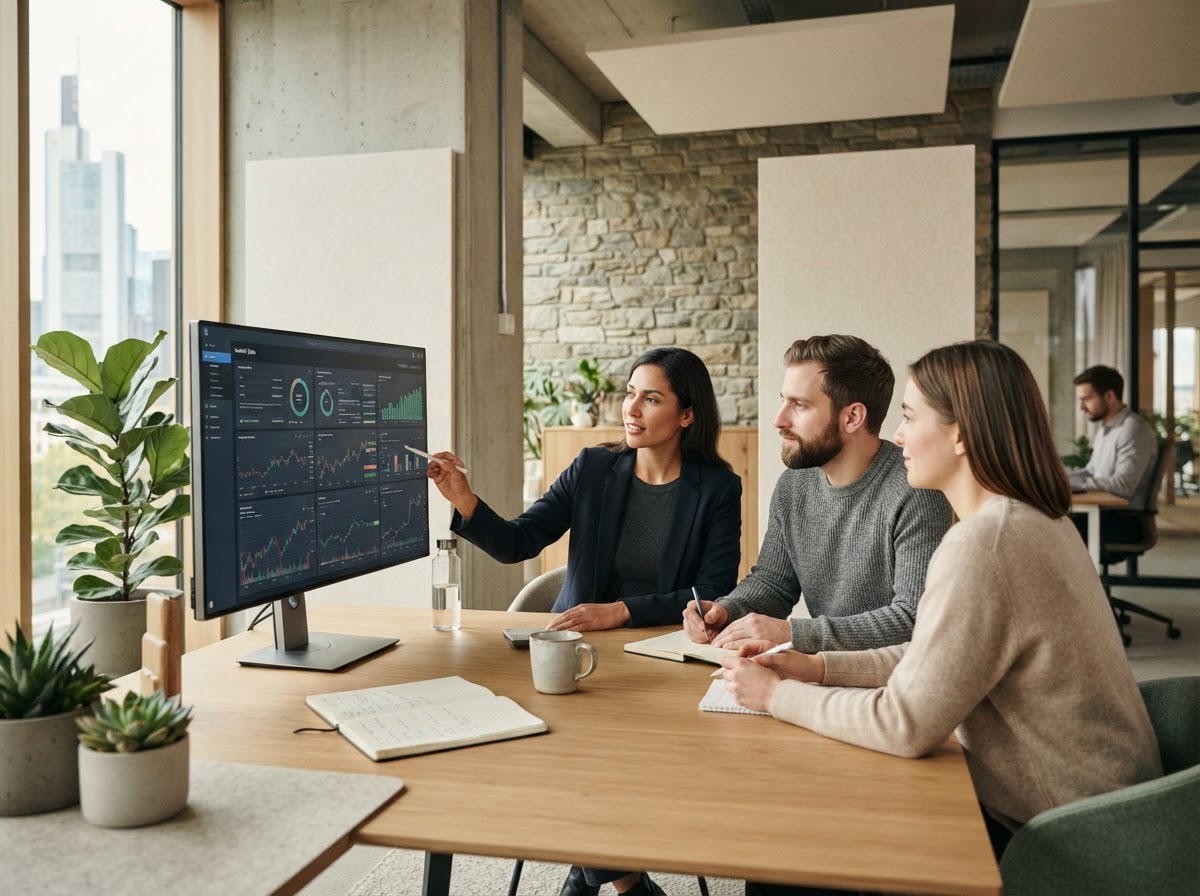
Every panel in Tradex GPT is built around a single principle: show what's relevant to the task, and keep the rest out of view until needed. Layouts are consistent across modules, so switching between a watchlist, a chart, and a portfolio summary doesn't require re-learning the interface each time.
Data density is adjustable — compact views for quick scanning, expanded views for closer inspection — so the dashboard adapts to the stage of research you're in rather than dictating it.
From raw data to a usable view
Behind each screen, Tradex GPT follows the same sequence — data is gathered, organized, then presented in a form built for review, not automated decisions.
Data aggregation
Pricing and instrument data is pulled from multiple market sources into a single structured feed.
Organization & filtering
Information is sorted into the modules you use — screeners, watchlists, portfolio views — based on the criteria you've set.
Presentation & review
Data is displayed in consistent, comparable layouts so you can review, annotate, and decide on your own terms.
Details worth knowing
A closer look at how specific parts of the dashboard behave in practice.
How are watchlists structured?
Watchlists are user-defined groups of instruments. You choose what belongs in each list and how it's labeled; the dashboard simply keeps the data for those instruments updated and displayed consistently.
Can I adjust how much data is shown per panel?
Yes. Most panels support a compact or expanded view, letting you scan quickly or inspect specific figures in more depth without leaving the module.
Does the portfolio overview execute any actions?
No. The portfolio module is a read-only summary of holdings and figures you input or connect. It does not place orders or manage assets automatically.
How do alerts work?
Alerts are notifications tied to conditions you configure, such as a price level or data threshold. They inform you of a change; they do not trigger any automated response.
See how the modules work together
Open the dashboard to explore screening, watchlists, and portfolio views built for structured, data-backed research.